Charts
A query can be visualized as a chart. You can add a chart to a dashboard by clicking the Edit button in the top right corner of the dashboard and dragging the chart widget to the dashboard.
Chart types
You can choose between the following chart types:
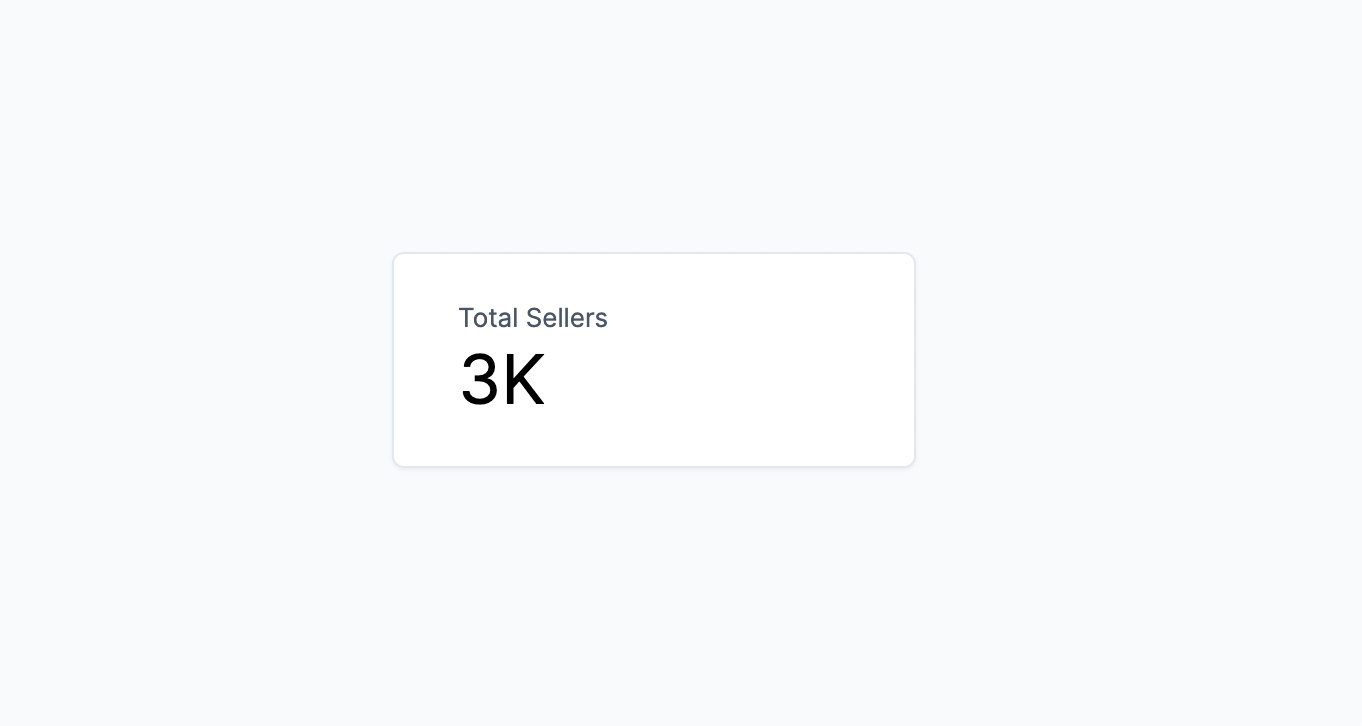
- Number
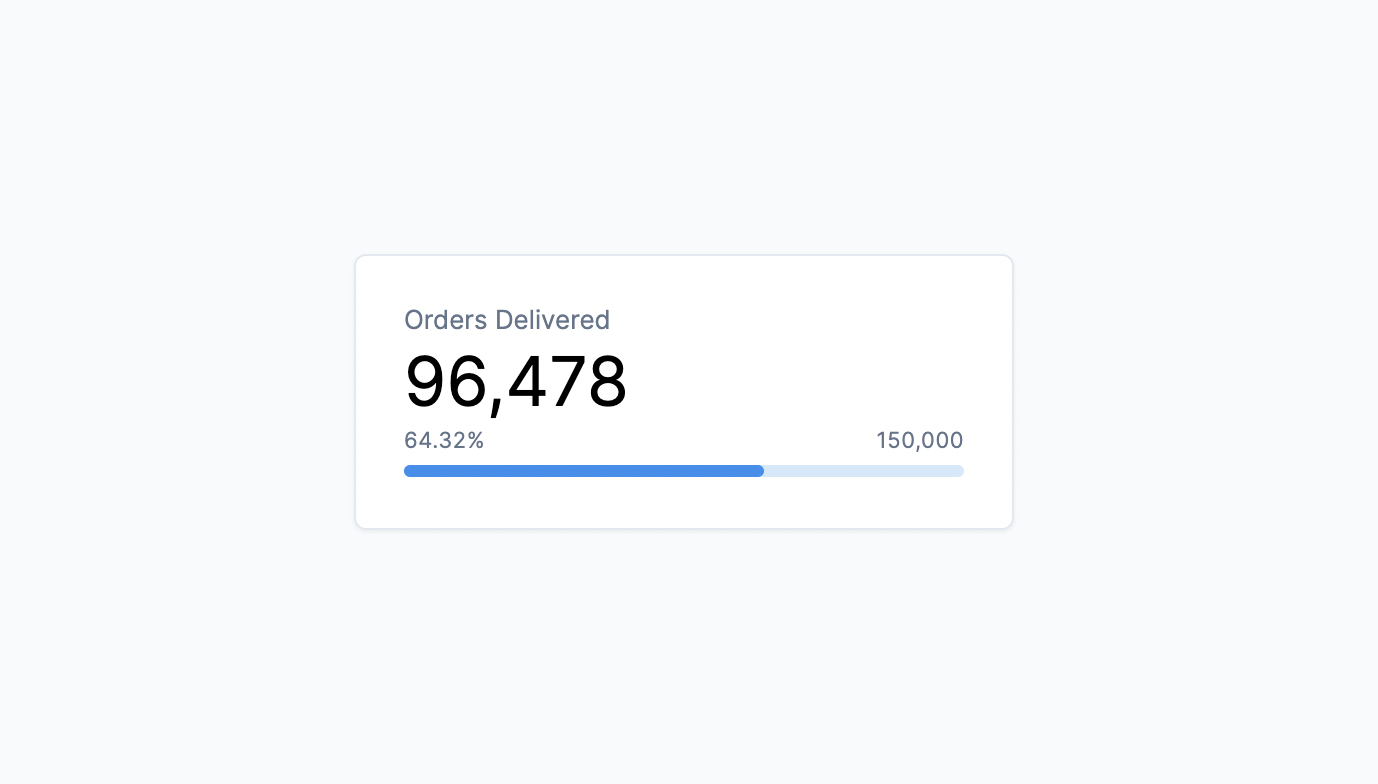
- Progress
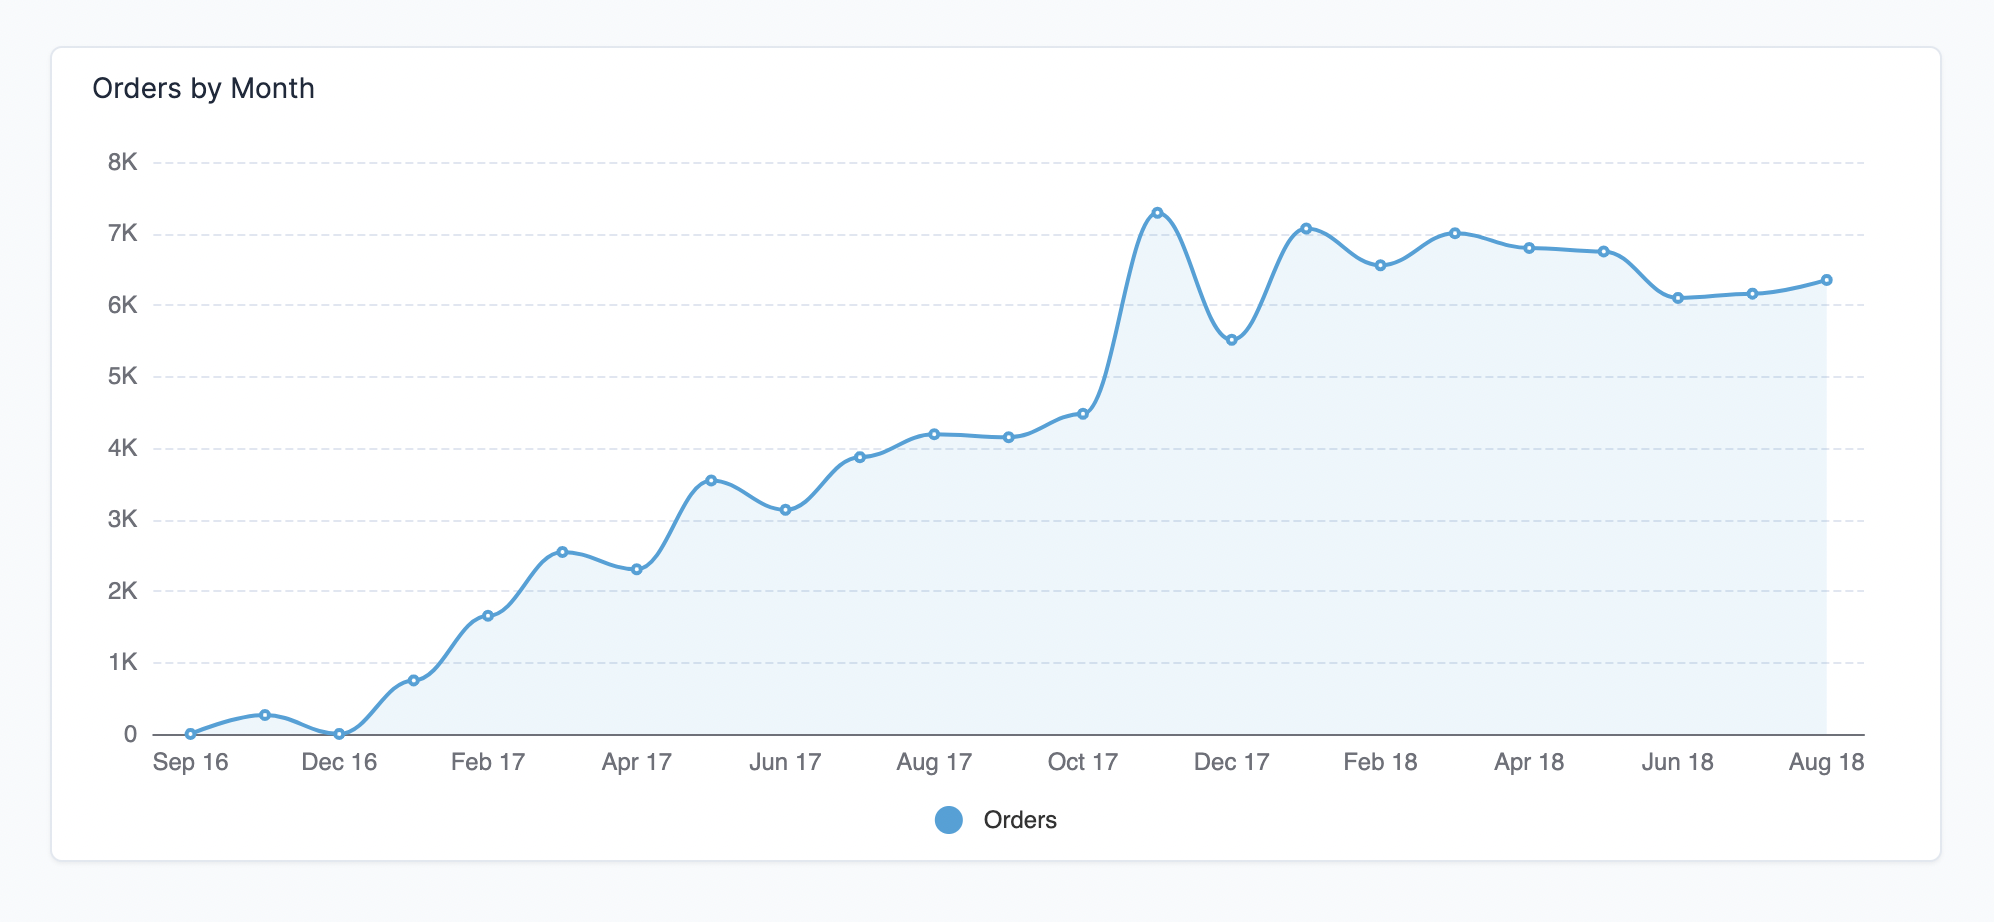
- Line chart
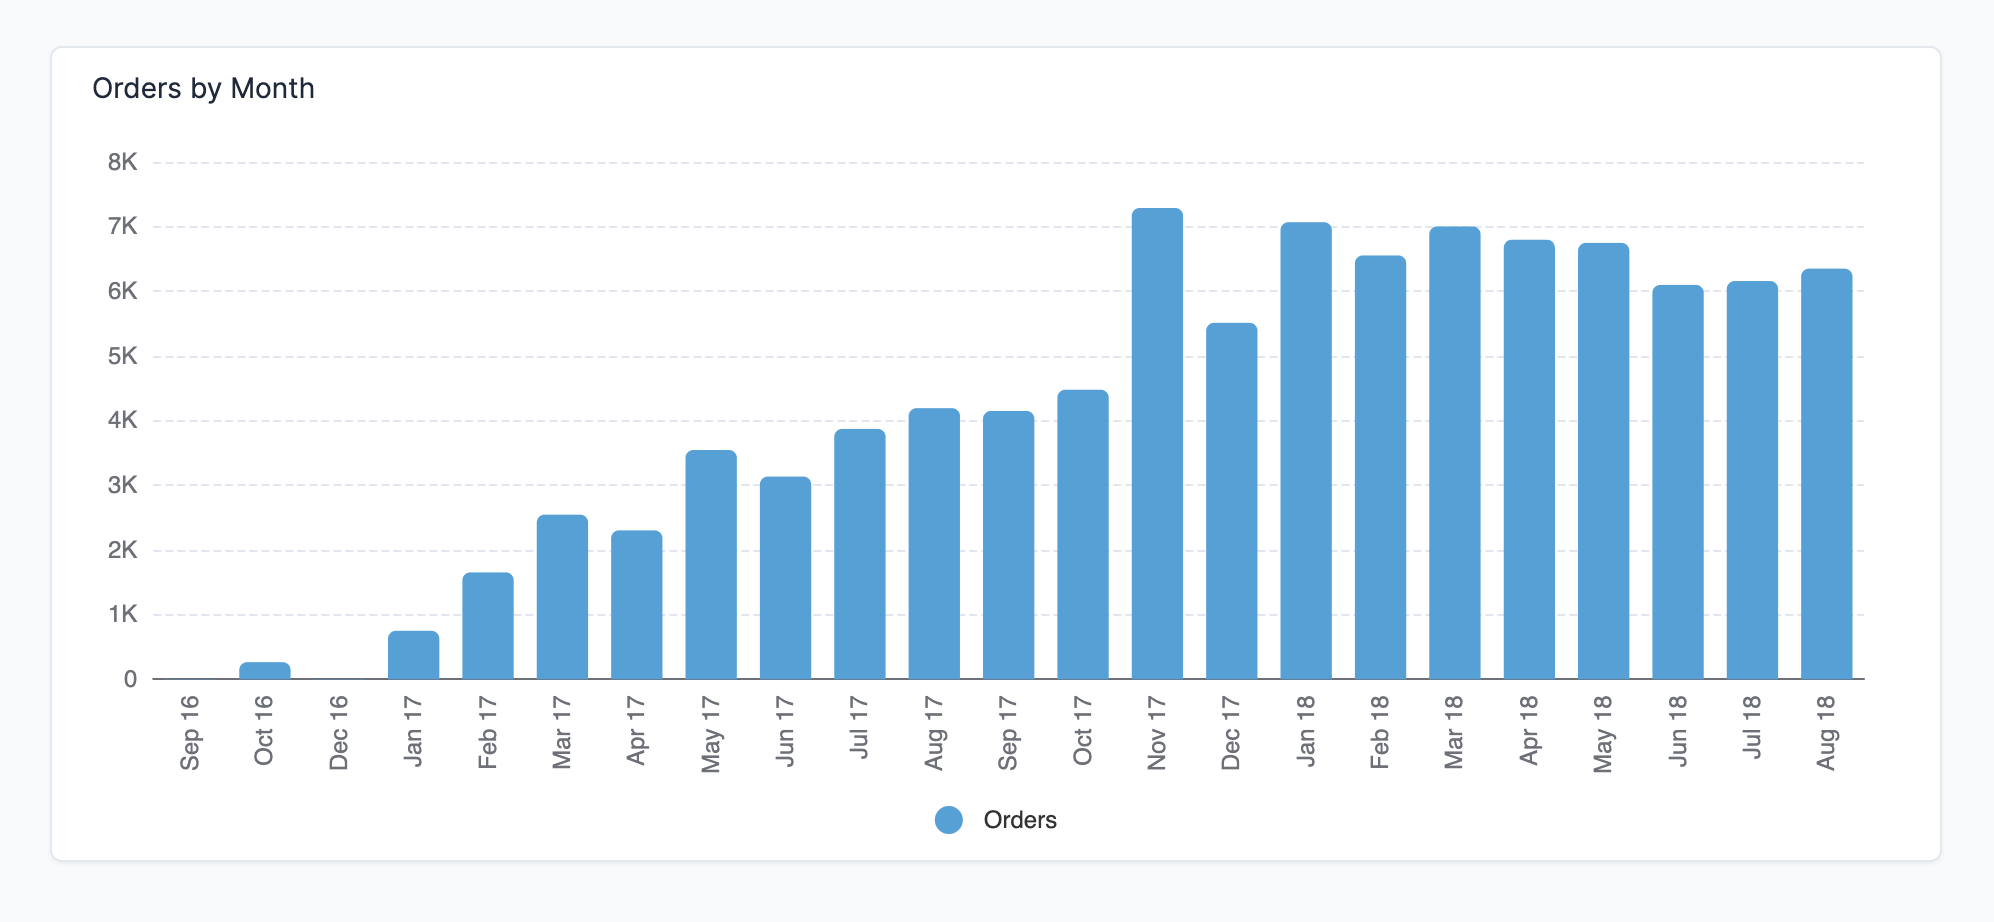
- Bar chart
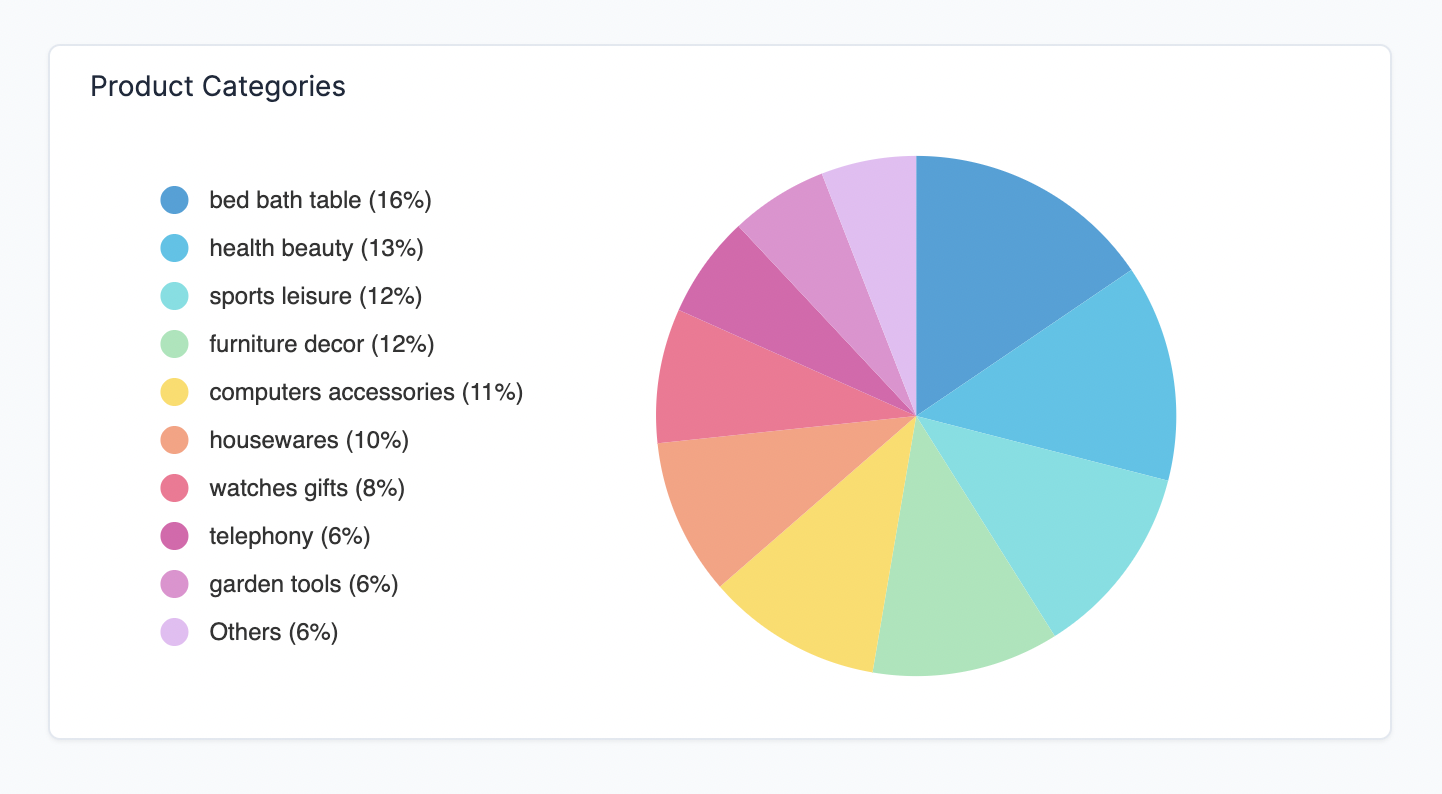
- Pie chart
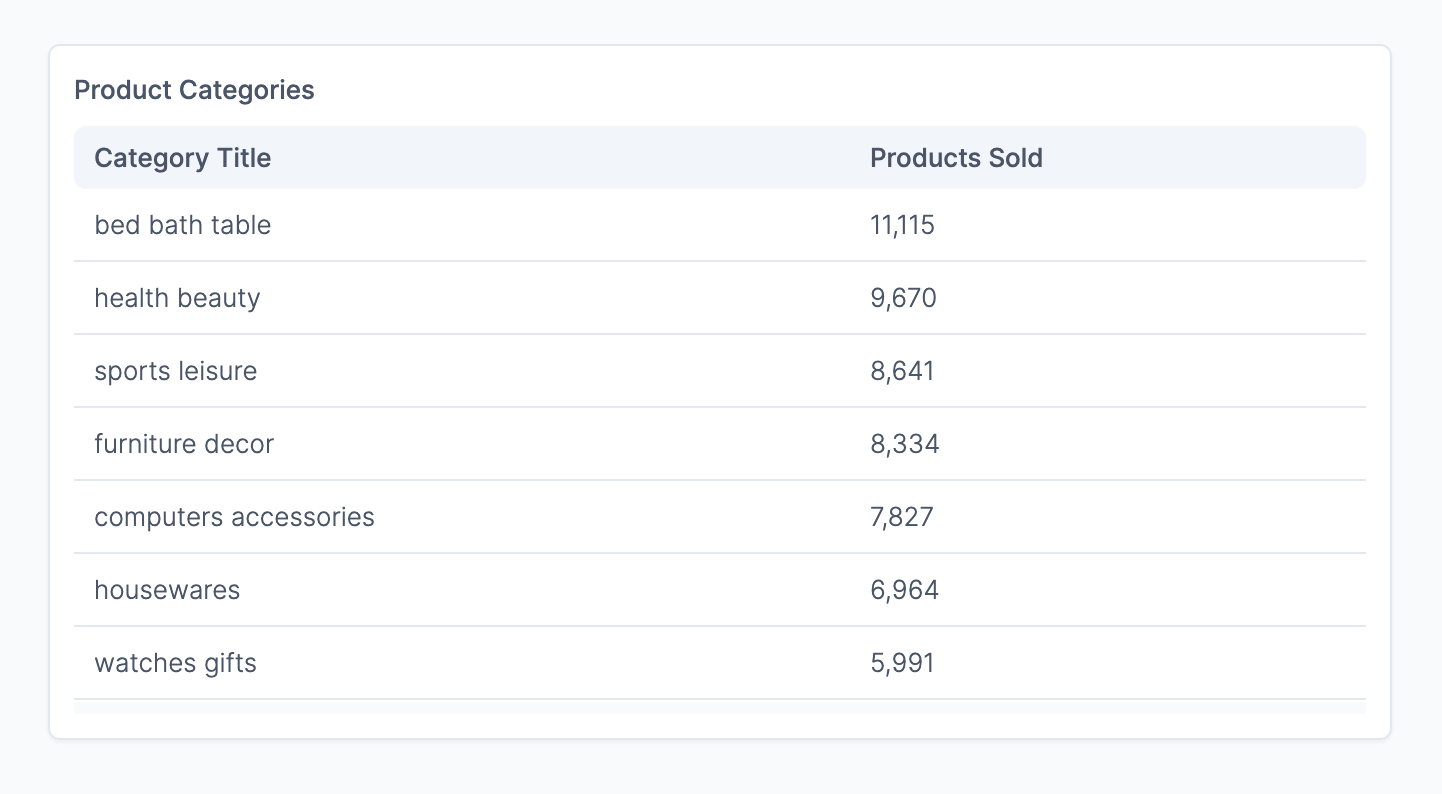
- Table