Dashboards
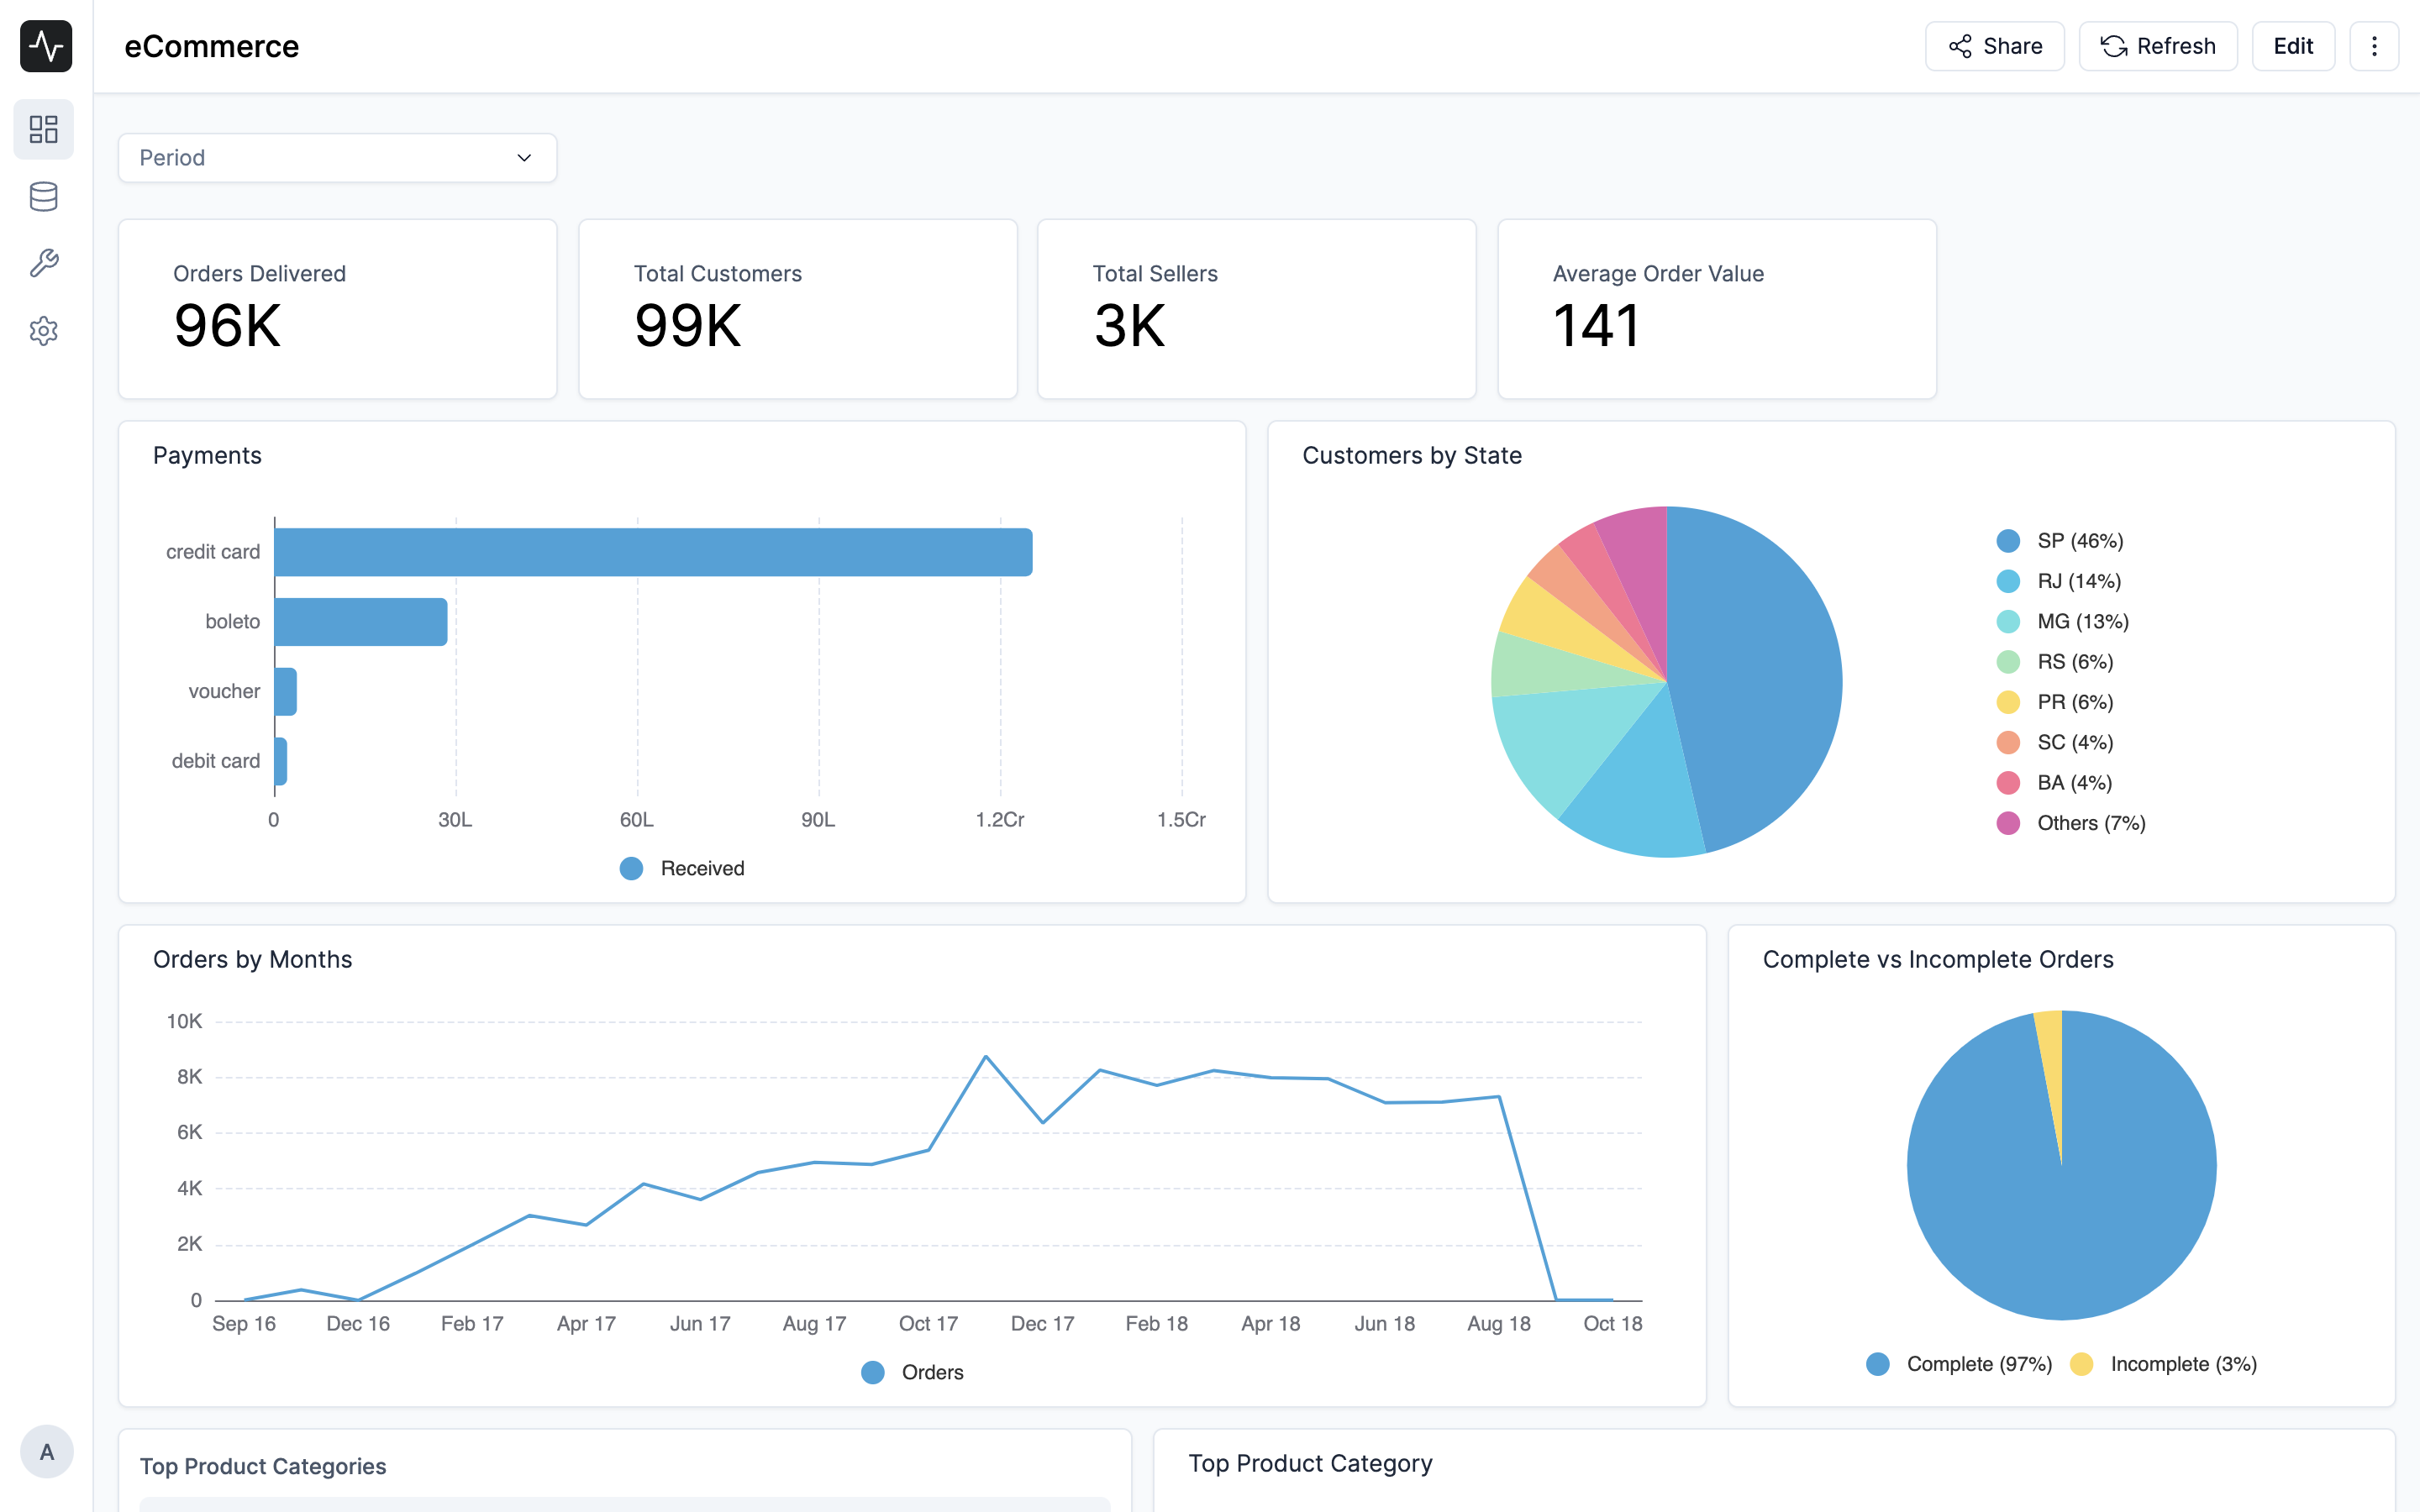
Dashboards are a group of related visualizations that you can use to track and monitor your data. You can share a dashboard with your team or subscribe to it to receive regular notifications.
A Dashboard is a grid which contains cards. Cards can be a chart, a filter, a table, or a text box. You can add as many cards as you want to a dashboard.
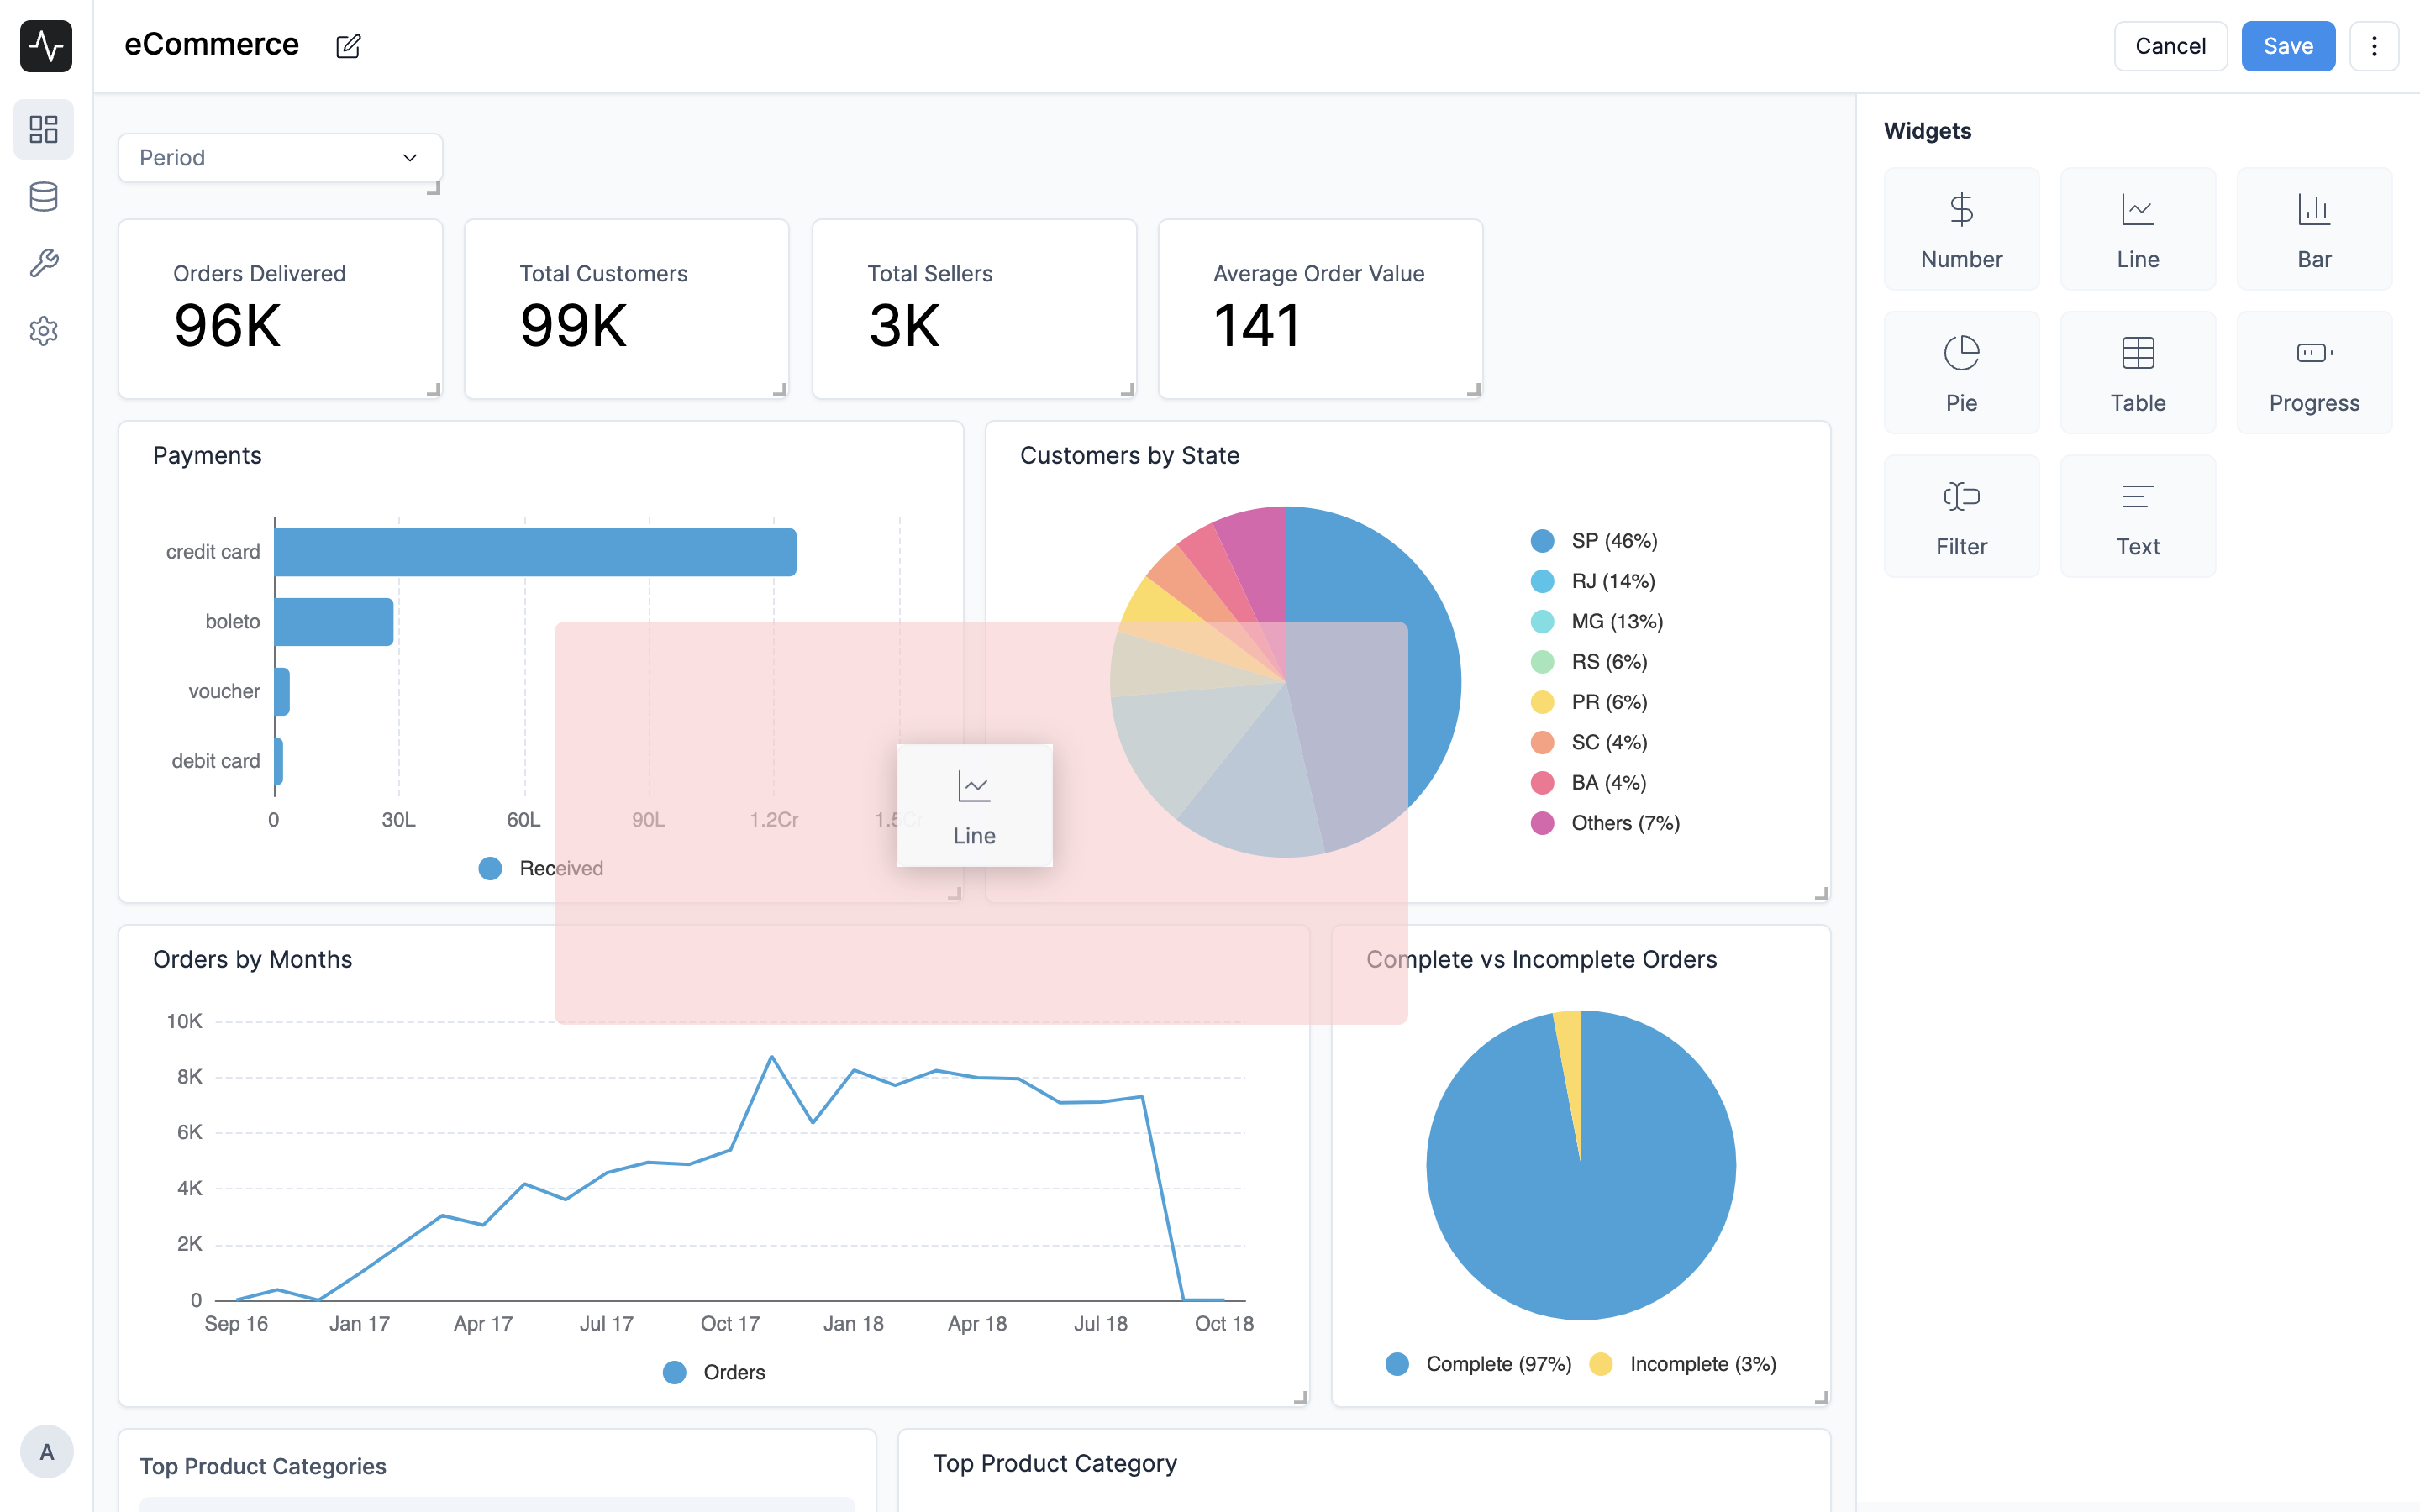
Add a card
To add a card to a dashboard, click the Edit button in the top right corner of the dashboard. You'll see a list of all the widgets you can add to the dashboard. You can drag and drop the widgets you want to add to the dashboard.
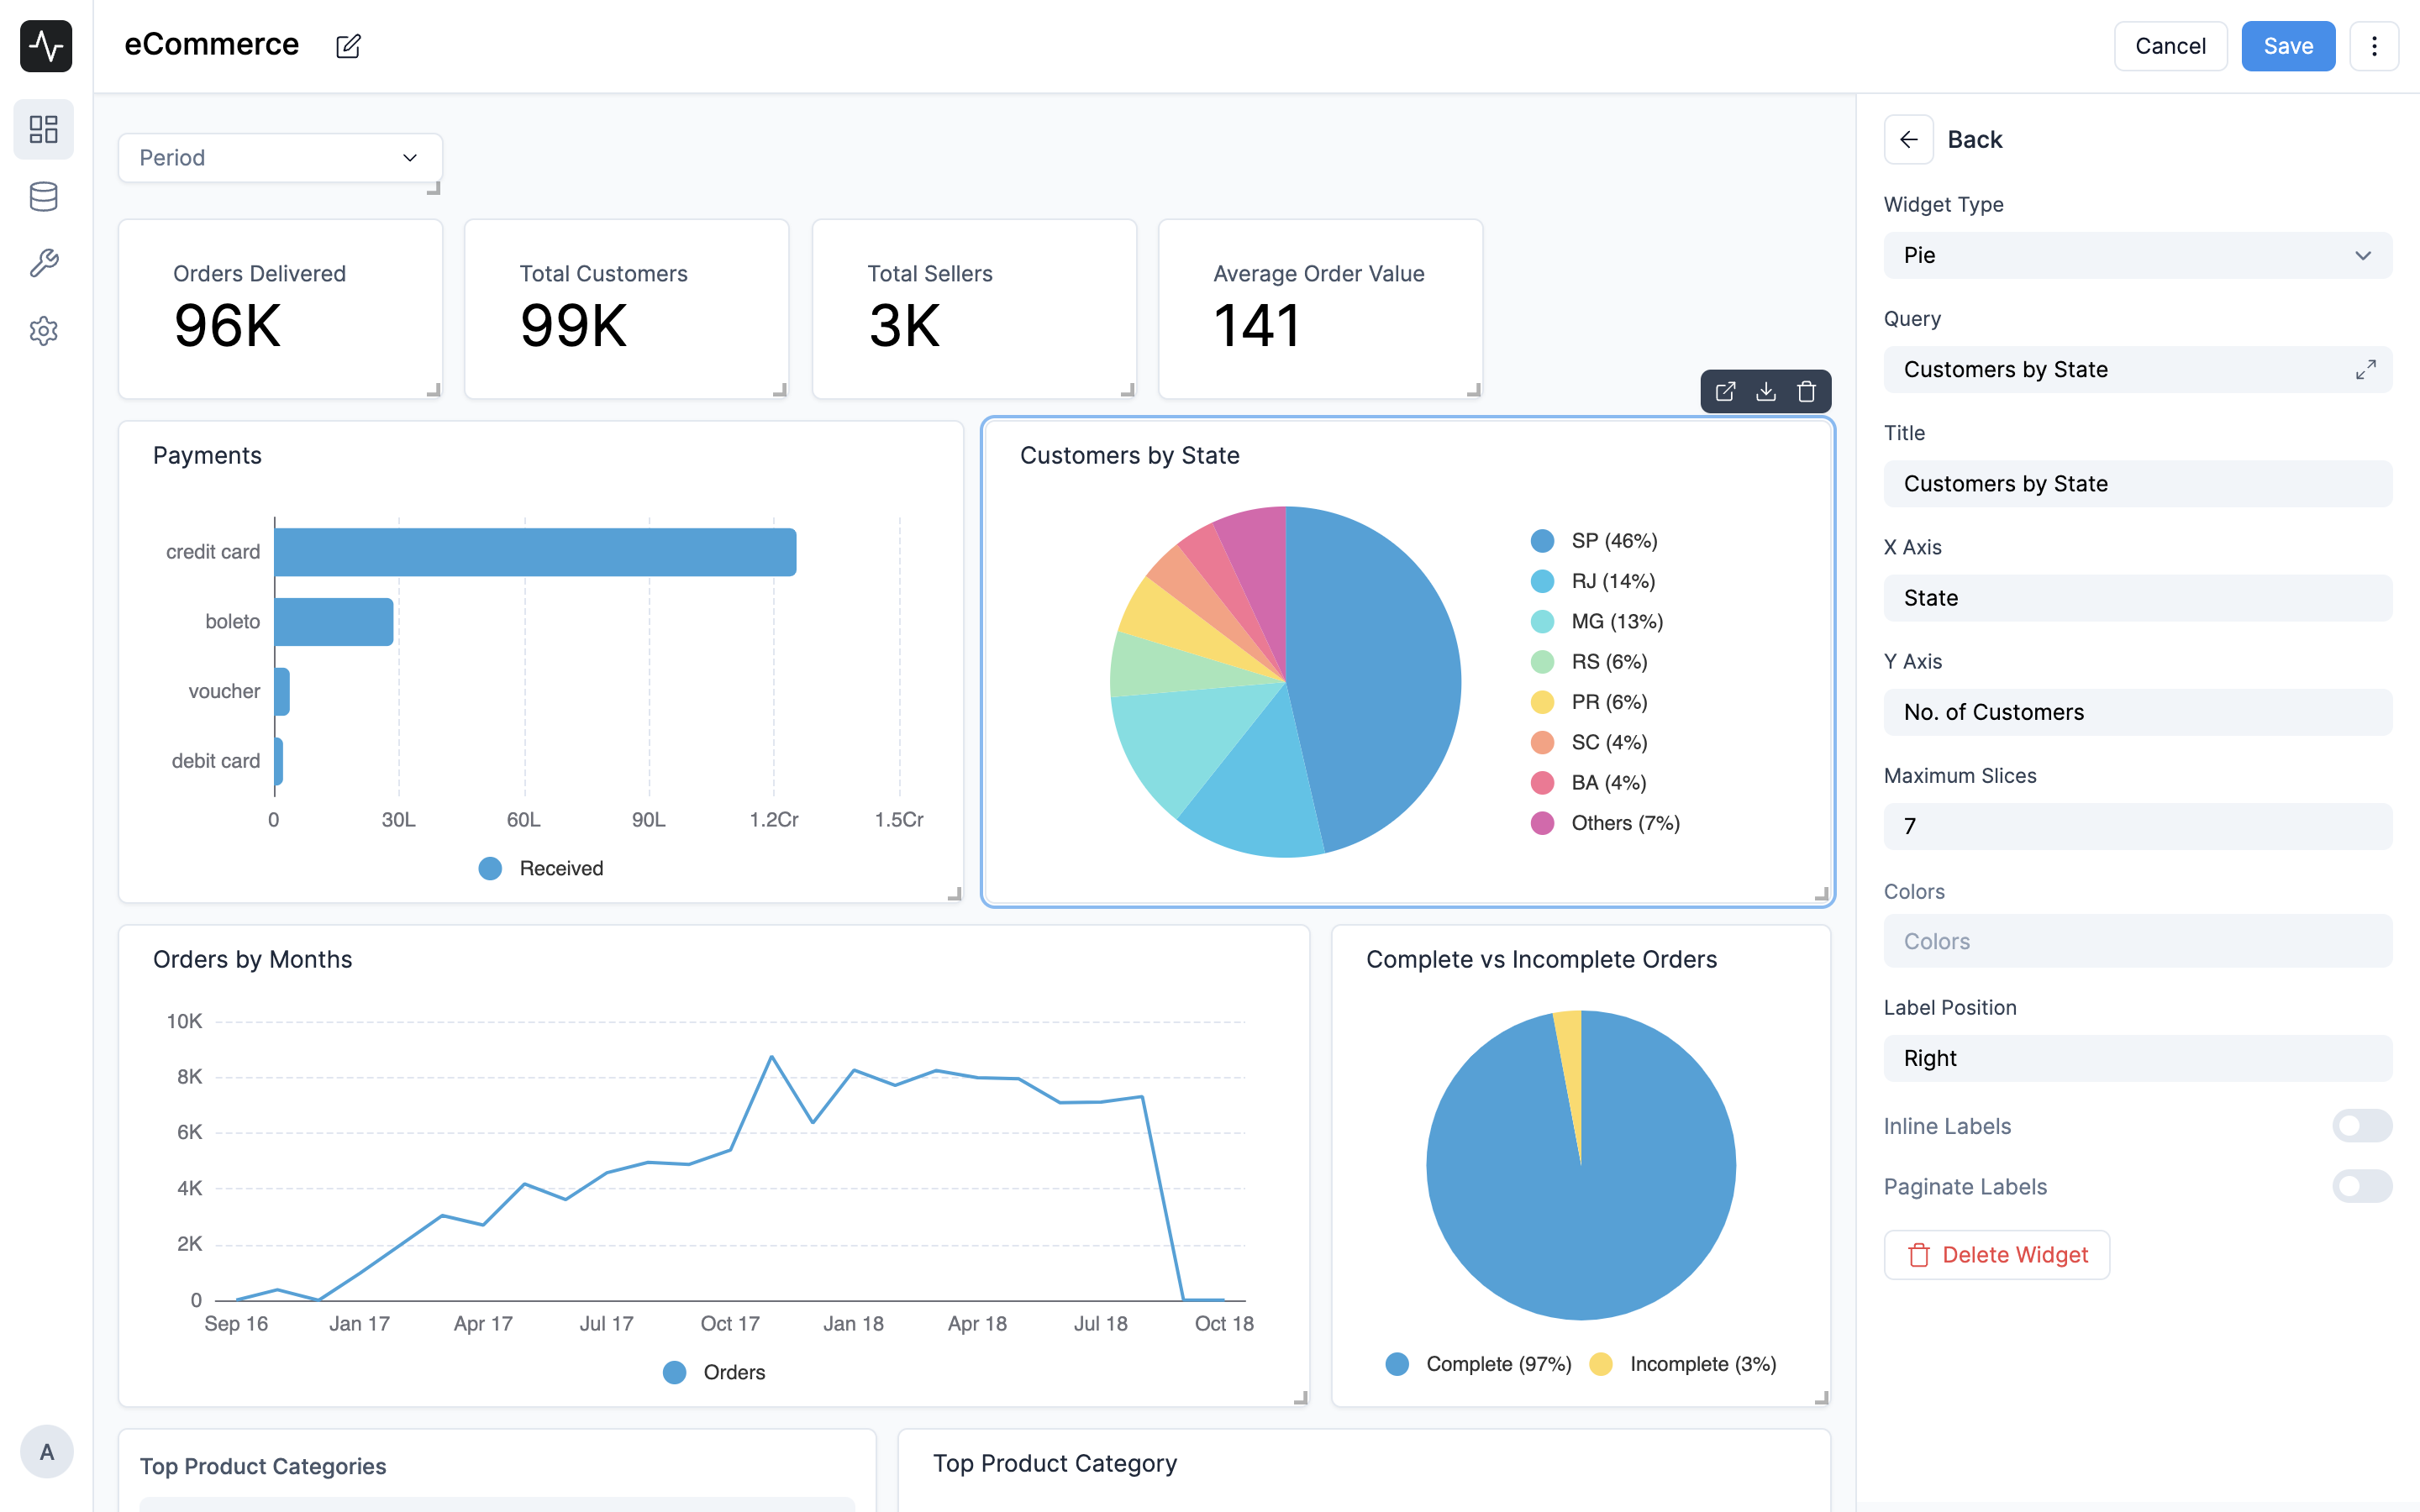
Edit a card
To edit a card, click the Edit button in the top right corner of the dashboard and click on the card you want to edit. You'll see a sidebar with all the options to edit the card.
You can also delete a card by clicking the Delete button at the bottom of the sidebar.
Reorder cards
To reorder cards, click the Edit button in the top right corner of the dashboard. You can then drag and drop the cards to reorder them.
Don't forget to click the Save button at the bottom of the sidebar to save your changes.